


| Note: | The Color Wavelength range is from 360 to 780 nm, input can be floating point. |
| The Color Temperature range is from 1000 to 25000 K, input can be floating point. |
Please enter a valid value.
The Correlated Color Temperature (CCT) to the x,y points on the xyY table were integrated over the product of CIE 1931 2 degree lambda functions (360...780nm, floating point) and the Planck’s law energy distribution.
| Note 1: | The CIE A, B,C and D white-points are special cases. |
| Note 2: | The CIE approximation functions to the black-body curve (that results the CIE Dnnnn values) are about 1% off from the accurate blackbody curve. |
The 1931 CIE (x, y) chromaticity coordinates are calculated from the spectral power distribution of the light source and the CIE color-matching functions (Figure A-1).
The color-matching functions give the tristimulus value X,Y and Z:
| X=∫ p | x | dλ, | Y=∫ p | y | dλ, | Z=∫ p | z | dλ |
where p is the SPD of the light source. From X, Y and Z, the chromaticity coordinates x, y, z can be obtained as follows:

Figure 1. The CIE color-matching functions
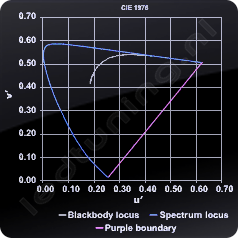
The CIE 1976 chromaticity diagram was constructed by mathematically transforming the x, y chromaticity coordinates to u’, v’:
In the u’, v’ color space, the same distance between any two points are presumed to be perceptually equal.
Since it is known that the chromaticity of any light source can be determined by a linear combination of three primaries, it is possible to abandon the use of real primaries in favor of imaginary primaries that have some useful characteristics.
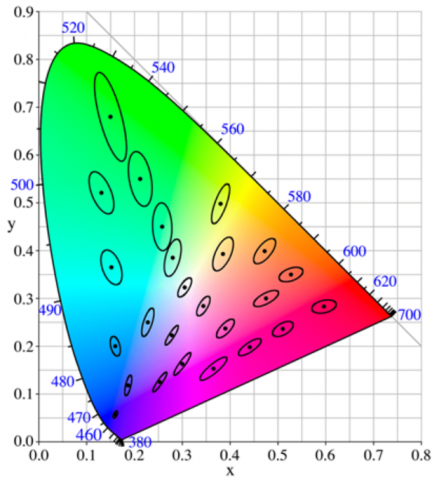
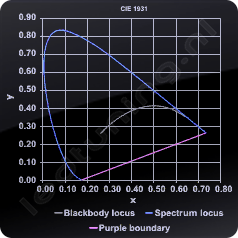
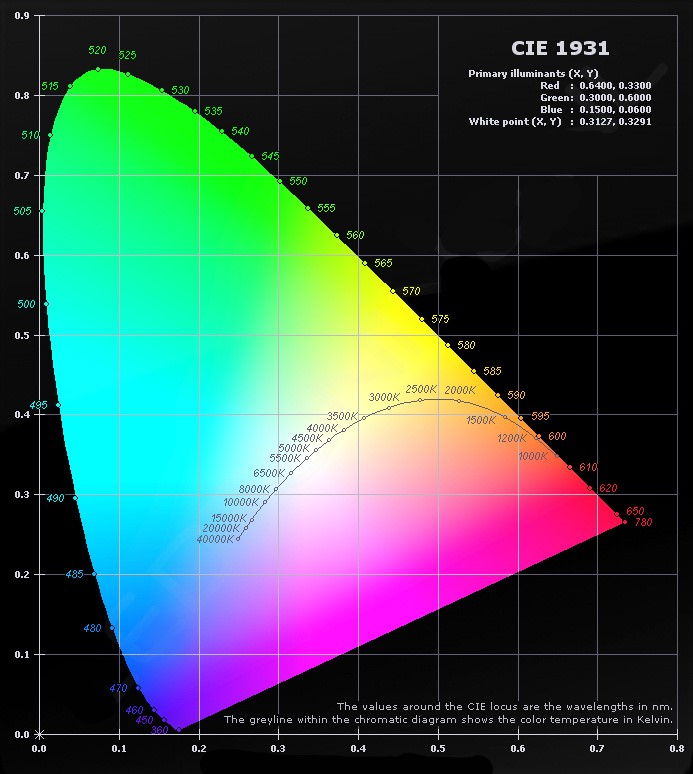
The CIE 1931 system of colorimetry uses the photopic luminous efficiency function V(l) as one of the three imaginary primaries. In this way the CIE system of colorimetry was simultaneously integrated with the CIE system of photometry. Figure 2 compares the CIE 1931 two-dimensional chromaticity diagram with the CIE 1976 diagram, both of which utilize imaginary primaries. Also plotted in the diagrams is the blackbody locus, which represents the chromaticities of a blackbody radiator source, heated to incandescence.
|
|
Figure 2. The CIE 1931 and CIE 1976 Chromaticity Diagrams
Explanation of CIE 1931
The Commission Internationale de l’Eclairage (CIE), internationally better known as International Commission on Illumination, is the international authority in the field of light, lightsources, color and colorspace. The CIE has its headquarters in Vienna, Austria. The CIE works together with the ISO orginisation and is seen by ISO as a standardization group.
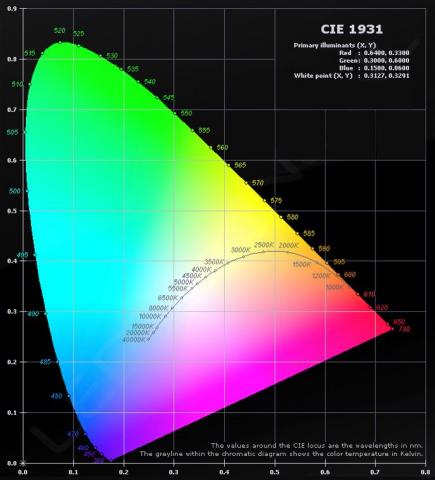
The CIE 1931 color space chromaticity diagram with wavelengths in nanometers, developed in 1931, is still used today as the standard to define colors, and as a reference for other color spaces. The figure is a two-dimensional display of colors with the same intensity (brightness), according to the standard-CIE-1931-perception that is based on observations of color measurements by humans. A complete display of colors is actually three-dimensional, where the z-axis displays the brightness.
 |
||
The CIE 1931 color space chromaticity diagram with wavelengths in nanometers.
The original CIE chromaticity diagram has been converted to RGB color space (see above CIE diagram) by the Techno Team Ledtuning.